
openEO Platform#
Big Data From Space 2023#
Exploring Corine Land Cover
Connect to openEO Platform using python#
import openeo
conn = openeo.connect("openeo.cloud")
conn = conn.authenticate_oidc()
Authenticated using refresh token.
Look at the collection description#
conn.describe_collection("corine_land_cover")
The Corine Land Cover classes and their associated numbers#
Pick a number for a class of interest#
This is not the full list but just to give an example
Number |
Class |
Number |
Class |
Number |
Class |
||
|---|---|---|---|---|---|---|---|
2 |
Discontinuous urban fabric |
9 |
Construction sites |
32 |
Sparsely vegetated areas |
||
3 |
Industrial or commercial units |
10 |
Green urban areas |
33 |
Burnt areas |
||
4 |
Road and rail networks and associated land |
11 |
Sport and leisure facilities |
34 |
Glaciers and perpetual snow |
Start creating an openEO process graph#
Pick a spatial extent of interest#
spatial_extent = {"west": 12.1783447265625,
                  "south": 46.9061837801476,
                  "east": 13.50151062011719,
                  "north": 47.093500502407764}
Load the corine land cover collection#
data = conn.load_collection('corine_land_cover', spatial_extent = spatial_extent, temporal_extent = ["2000-01-01","2020-06-30"])
If you are interested in a specific class, pick the number of the class and set the data equal to it.#
data_34 = data == 34
Save the result as a netCDF#
saved_data = data_34.save_result(format="NetCDF")
saved_data.flat_graph()
{'loadcollection1': {'process_id': 'load_collection',
  'arguments': {'id': 'corine_land_cover',
   'spatial_extent': {'west': 12.1783447265625,
    'south': 46.9061837801476,
    'east': 13.50151062011719,
    'north': 47.093500502407764},
   'temporal_extent': ['2000-01-01', '2020-06-30']}},
 'apply1': {'process_id': 'apply',
  'arguments': {'data': {'from_node': 'loadcollection1'},
   'process': {'process_graph': {'eq1': {'process_id': 'eq',
      'arguments': {'x': {'from_parameter': 'x'}, 'y': 34},
      'result': True}}}}},
 'saveresult1': {'process_id': 'save_result',
  'arguments': {'data': {'from_node': 'apply1'},
   'format': 'NetCDF',
   'options': {}},
  'result': True}}
Create and start a job#
job = saved_data.create_job()
job.start_job()
job
Once the job status says ‘finished’, results can be downloaded.#
results = job.get_results()
metadata = results.get_metadata()
results.download_files("./glaciers/")
[PosixPath('glaciers/EU010M_E049N015T1_20001215T000000.nc'),
 PosixPath('glaciers/EU010M_E049N015T1_20061215T000000.nc'),
 PosixPath('glaciers/EU010M_E049N015T1_20121215T000000.nc'),
 PosixPath('glaciers/EU010M_E049N015T1_20181215T000000.nc'),
 PosixPath('glaciers/EU010M_E050N015T1_20001215T000000.nc'),
 PosixPath('glaciers/EU010M_E050N015T1_20061215T000000.nc'),
 PosixPath('glaciers/EU010M_E050N015T1_20121215T000000.nc'),
 PosixPath('glaciers/EU010M_E050N015T1_20181215T000000.nc'),
 PosixPath('glaciers/job-results.json')]
data_2000 = data_34.filter_temporal(extent=["2000-01-01", "2000-12-31"]).drop_dimension(name="t")
data_2018 = data_34.filter_temporal(extent=["2018-01-01", "2018-12-31"]).drop_dimension(name="t")
difference = data_2000 - data_2018
saved_diff = difference.save_result(format="NetCDF")
saved_diff.flat_graph()
{'loadcollection1': {'process_id': 'load_collection',
  'arguments': {'id': 'corine_land_cover',
   'spatial_extent': {'west': 12.1783447265625,
    'south': 46.9061837801476,
    'east': 13.50151062011719,
    'north': 47.093500502407764},
   'temporal_extent': ['2000-01-01', '2020-06-30']}},
 'apply1': {'process_id': 'apply',
  'arguments': {'data': {'from_node': 'loadcollection1'},
   'process': {'process_graph': {'eq1': {'process_id': 'eq',
      'arguments': {'x': {'from_parameter': 'x'}, 'y': 34},
      'result': True}}}}},
 'filtertemporal1': {'process_id': 'filter_temporal',
  'arguments': {'data': {'from_node': 'apply1'},
   'extent': ['2000-01-01', '2000-12-31']}},
 'dropdimension1': {'process_id': 'drop_dimension',
  'arguments': {'data': {'from_node': 'filtertemporal1'}, 'name': 't'}},
 'filtertemporal2': {'process_id': 'filter_temporal',
  'arguments': {'data': {'from_node': 'apply1'},
   'extent': ['2018-01-01', '2018-12-31']}},
 'dropdimension2': {'process_id': 'drop_dimension',
  'arguments': {'data': {'from_node': 'filtertemporal2'}, 'name': 't'}},
 'mergecubes1': {'process_id': 'merge_cubes',
  'arguments': {'cube1': {'from_node': 'dropdimension1'},
   'cube2': {'from_node': 'dropdimension2'},
   'overlap_resolver': {'process_graph': {'subtract1': {'process_id': 'subtract',
      'arguments': {'x': {'from_parameter': 'x'},
       'y': {'from_parameter': 'y'}},
      'result': True}}}}},
 'saveresult1': {'process_id': 'save_result',
  'arguments': {'data': {'from_node': 'mergecubes1'},
   'format': 'NetCDF',
   'options': {}},
  'result': True}}
job = saved_diff.create_job()
job.start_job()
job
results = job.get_results()
metadata = results.get_metadata()
results.download_files("./glaciers/")
[PosixPath('glaciers/EU010M_E049N015T1_NO_TIME.nc'),
 PosixPath('glaciers/EU010M_E050N015T1_NO_TIME.nc'),
 PosixPath('glaciers/job-results.json')]
Looking at the results using python matplotlib#
import os
import xarray as xr
import numpy as np
import matplotlib.pyplot as plt
path = "./glaciers/"
data_2000 = xr.open_mfdataset([path + file for file in os.listdir(path) if "2000" in file])
data_2018 = xr.open_mfdataset([path + file for file in os.listdir(path) if "2018" in file])
diff = xr.open_mfdataset([path + file for file in os.listdir(path) if "NO_TIME" in file])
corine_2000 = data_2000.B01.values
corine_2018 = data_2018.B01.values
diff = diff.to_array().values[0]
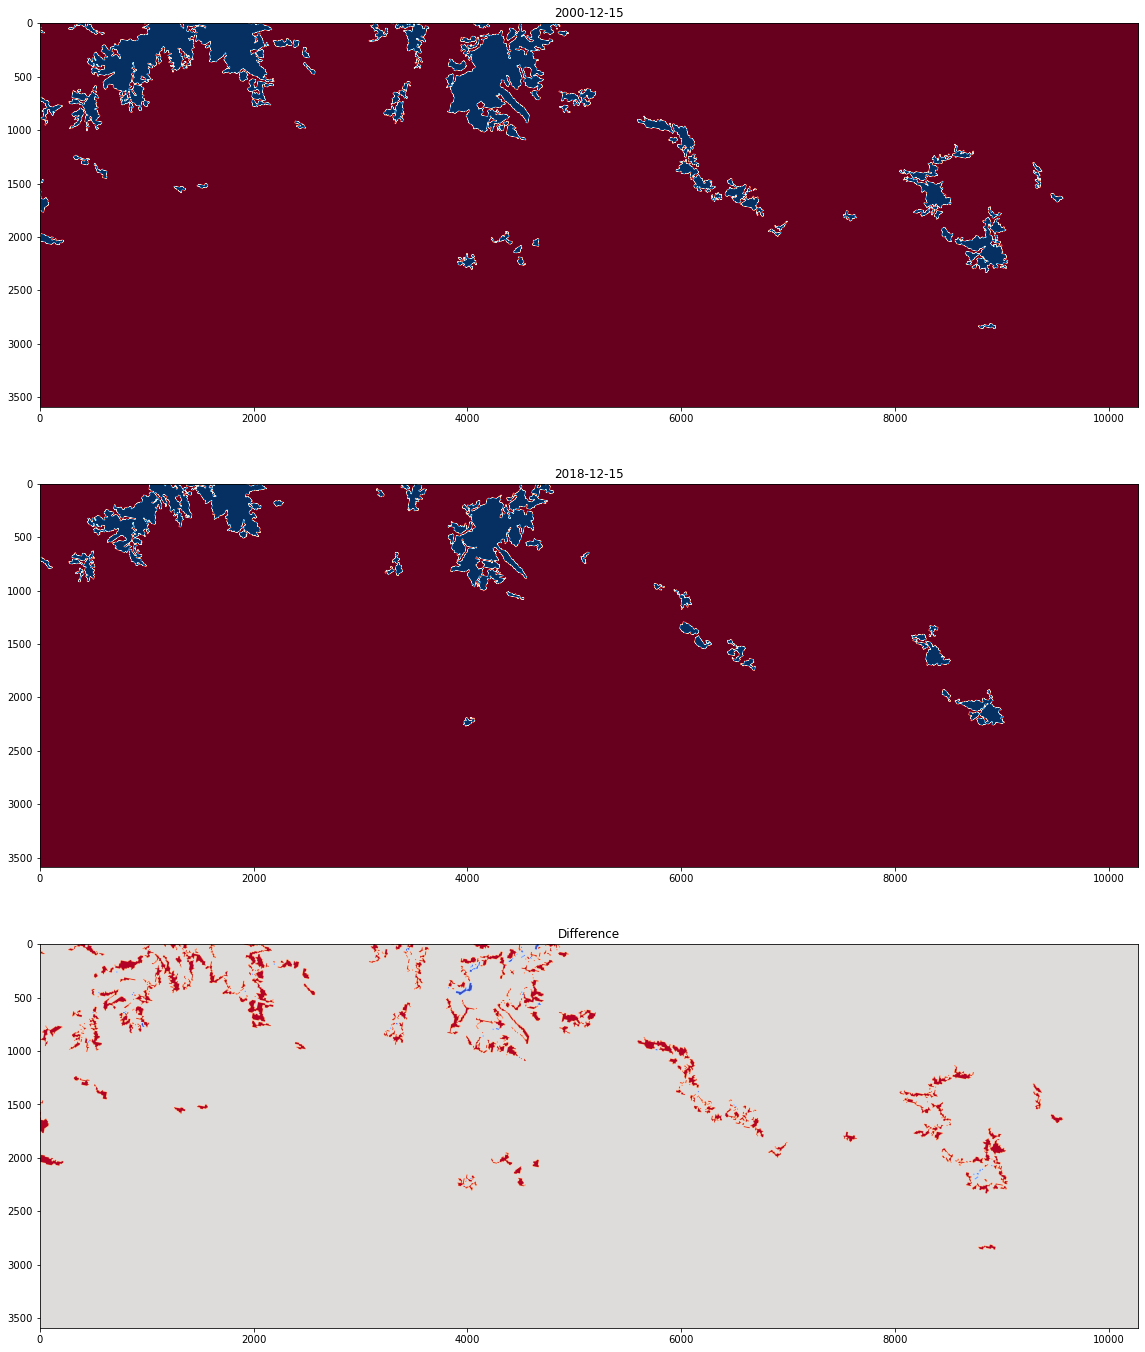
print("Glaciers and perpetual snow in 2000: ", np.sum(corine_2000))
print("Glaciers and perpetual snow in 2018: ", np.sum(corine_2018))
Glaciers and perpetual snow in 2000:  1796440.0
Glaciers and perpetual snow in 2018:  1060202.0
plt.figure(figsize=(24,24))

plt.subplot(3,1,1)
plt.title("2000-12-15")
plt.imshow(corine_2000, cmap = "RdBu")

plt.subplot(3,1,2)
plt.title("2018-12-15")
plt.imshow(corine_2018, cmap = "RdBu")

plt.subplot(3,1,3)
plt.title("Difference")
plt.imshow(diff, cmap = "coolwarm")
<matplotlib.image.AxesImage at 0x7f9e79a88880>